


The popular advice to improve your SEO visibility score and expect more traffic skips the most important check: did anyone click? I wouldn't approve an SEO report that presents visibility as proof of growth. You need a reproducible calculation, a record of which URLs earned the rankings, and clicks and conversions beside the score.
Table of Contents
- What an SEO Visibility Score Actually Measures
- How to Calculate Your Score in Five Steps
- A Worked Example With Three Keywords
- Where the Score Misleads You
- Tracking AI Overviews as a Separate Layer
- Raising Your Score Without Chasing Noise
- Confirm Your Score Against Clicks Before You Act
What an SEO Visibility Score Actually Measures
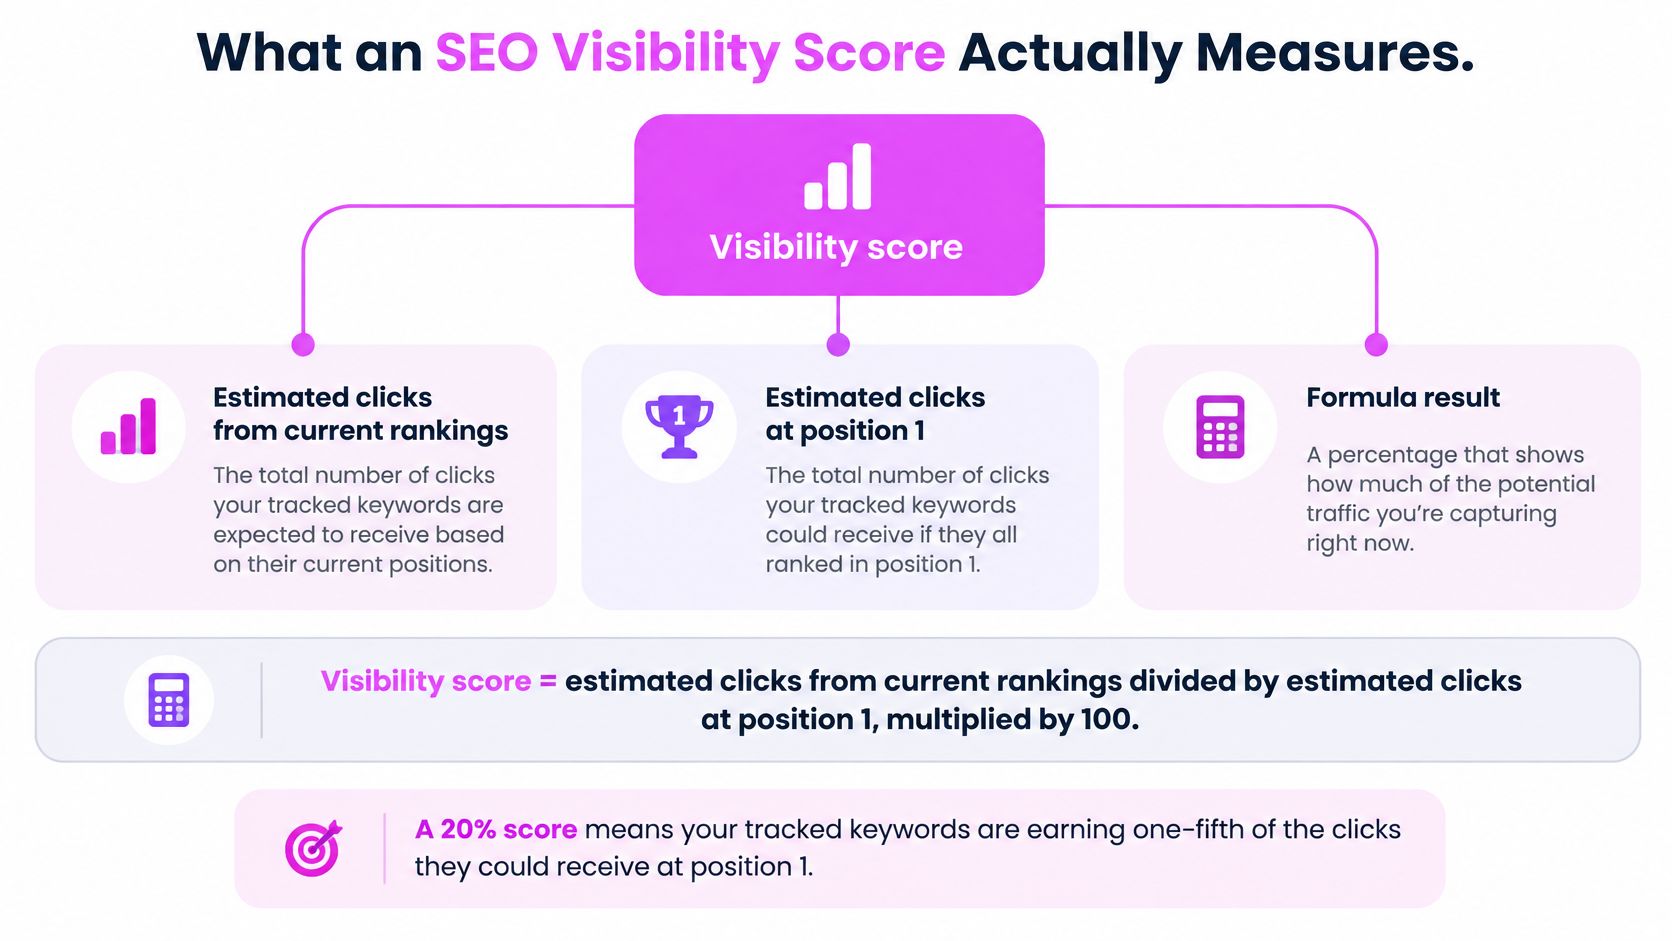
Visibility score = estimated clicks from current rankings ÷ estimated clicks at position 1 × 100. Under that model, a hypothetical 20% score means you're capturing one-fifth of the estimated click opportunity available if you ranked first for every tracked keyword, not one-fifth of all searches in your market. Sona's visibility methodology describes this position-, volume-, and CTR-weighted approach.
You need three inputs: ranking position, monthly search volume, and an assumed click-through rate, or CTR, for each position. Multiply volume by the applicable CTR to estimate clicks, then compare your current total with the position-one total. You're calculating an opportunity index, not measuring visits, sessions, or revenue.
Here's the relationship visually.
Why rank alone isn't enough
Say you're modelling a query with 50,000 monthly searches, ranking fifth, with an assumed 6% CTR. You'd estimate 3,000 clicks. For a different hypothetical query with 200 searches, a first-place ranking at an assumed 27% CTR produces just 54 estimated clicks.
The lower ranking contributes more because you're applying its CTR to much greater demand. Neither estimate is a traffic promise, and neither tells you whether those visitors would buy.
I would also keep content-quality assessments separate from search visibility. For that distinction, VeloCMS's SEO scoring guidance for bloggers is a useful companion when you're evaluating page-level optimization rather than market exposure.
Choose a comparison you can defend
Use your score for these comparisons:
- Your own history: Keep the measurement setup consistent so you can identify meaningful changes.
- Competitors: Measure every domain against the same keyword universe.
- A market segment: Isolate a country, product category, or intent group instead of hiding differences inside an overall average.
Don't compare percentages from unrelated platforms as if they share a denominator. Before calculating anything, write down your keyword set, monthly volumes, current positions, country, and device, then freeze that setup.
How to Calculate Your Score in Five Steps
Start in a spreadsheet, even if you'll eventually automate the dashboard. You should be able to inspect every contribution before trusting an aggregate.
Create columns for keyword, country, device, date, ranking URL, volume, position, modelled CTR, estimated current clicks, and estimated maximum clicks. Keep the original exports alongside the calculation so you can distinguish a ranking change from an import error.
Build the calculation
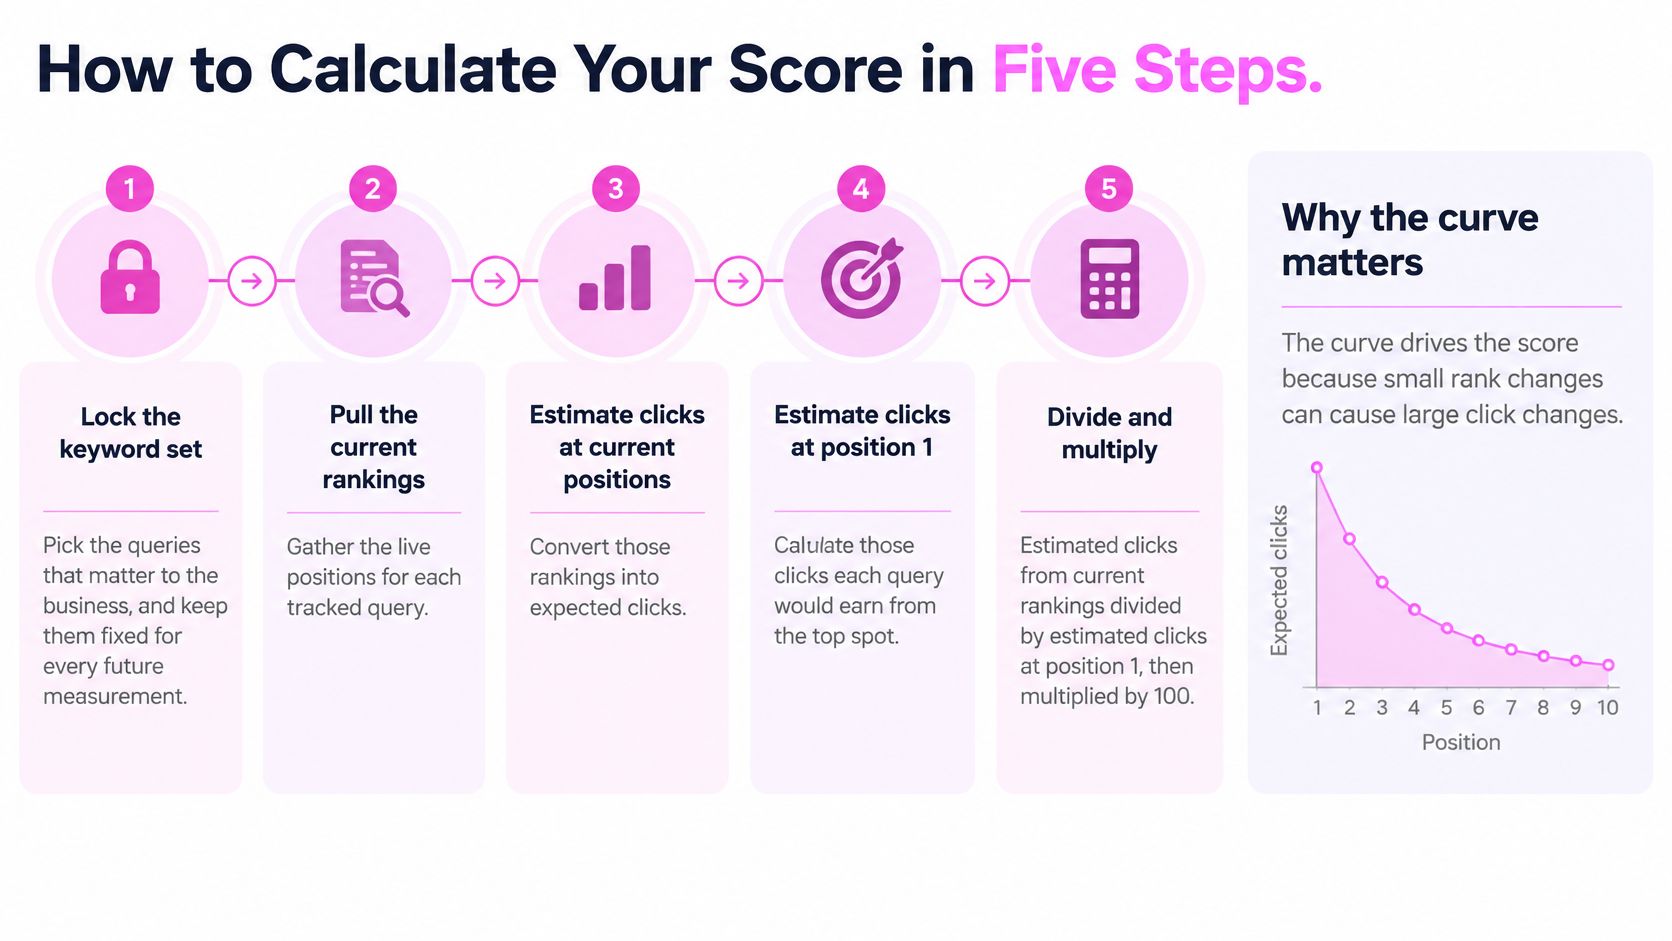
Lock the keyword set. Select queries that represent your products, services, and relevant buying journey, then preserve that list for comparisons. Don't automatically add every newly discovered ranking, because changing the sample changes what you're measuring.
Pull positions, volumes, and ranking URLs. Use the same location, device, search engine, and collection method throughout. Record the actual ranking page beside the intended page so a domain-level gain doesn't conceal an unsuitable landing page.
Apply a consistent CTR curve. Look up the CTR assigned to each position rather than typing percentages manually into individual rows. Treat the curve below as an illustrative model, not a measured benchmark for your site.
Example CTR curve used in the visibility calculation
| Position | Modelled CTR | How to use it |
|---|---|---|
| 1 | 27% | Denominator for every keyword |
| 2 | 15% | Second-largest share of clicks |
| 3 | 11% | Still inside the top-three concentration |
| 4 | 8% | Modelled drop-off continues |
| 5 | 6% | Don't assume a fixed screen fold |
| 6–10 | 3% | Applied to each of positions 6 to 10 in this example |
| 11 and below | 0% | Outside the modelled curve, contributes no clicks |
Calculate estimated current clicks. Multiply each keyword's search volume by its assigned CTR, then sum the results. Preserve the individual contributions so you can explain which query caused a change.
Build the denominator and divide. Multiply every tracked keyword's volume by the position-one CTR and add those estimates together. Divide your estimated current clicks by that maximum and multiply by 100 to express the result as a percentage.
The process is straightforward when you keep the numerator and denominator visible.
Test the assumptions before automating
The denominator answers a specific question: what would this same keyword portfolio contribute if you held the top position throughout? It isn't total search demand. Using raw search volume as the denominator would produce a different metric.
The weighting matters because you shouldn't value every ranking improvement equally. The Software Toolbox discussion of organic CTR benchmarks explains why position-weighted measurement is more informative than counting ranking keywords.
Within this example curve, movement near the top changes the assigned click opportunity more sharply than movement between lower positions. But the simplified lower-position grouping also means some real ranking improvements won't change your score at all.
Implementation check: Change a ranking manually in a test copy. Confirm that only its assigned CTR, estimated clicks, and aggregate contribution change.
Keep missing observations distinct from rankings outside your cutoff. A failed ranking check isn't evidence that you've lost the result, and replacing missing observations with zero can create a false decline.
Finally, decide how you'll handle search-volume updates. I would preserve a fixed-volume comparison for diagnosing ranking changes and maintain a separate current-demand view for planning. Otherwise, you can mistake a revised demand estimate for better SEO performance.
A Worked Example With Three Keywords
A score of 20% sounds weak until you see what it prices in. It already assumes you lose most clicks to higher rankings.
Take a hypothetical software site tracked on three terms with the illustrative CTR curve. Seo visibility score tool carries 1,200 monthly searches, keyword rank tracker carries 900, and backlink checker carries 3,000. Positions sit at third, fifth, and eighth. These are scenario inputs, not live volume estimates.
Worked visibility calculation for three keywords
| Keyword | Current position | Modelled CTR |
|---|---|---|
| seo visibility score tool | 3 | 11% |
| keyword rank tracker | 5 | 6% |
| backlink checker | 8 | 3% |
| Total from current rankings | 276 estimated clicks | |
| Denominator: volume times position-1 CTR | 1,377 estimated clicks | 27% |
| Visibility score: 276 divided by 1,377 | about 20% |
Calculate the contribution, not just the position
Your arithmetic is:
- SEO visibility score tool: 1,200 × 11% = 132 estimated clicks.
- Keyword rank tracker: 900 × 6% = 54 estimated clicks.
- Backlink checker: 3,000 × 3% = 90 estimated clicks.
- Current total: 132 + 54 + 90 = 276 estimated clicks.
- Position-one denominator: (1,200 + 900 + 3,000) × 27% = 1,377 estimated clicks.
- Visibility score: 276 ÷ 1,377 × 100 = approximately 20%.
The eighth-place backlink query contributes more than the fifth-place rank-tracker query, despite its weaker position. It stays below the third-place visibility-tool query, with 90 against 132.
Volume can outweigh position. Multiplication proves it. Assumption does not.
Don't calculate from a property-level average
Google Search Console position needs careful handling. Google's performance-metric documentation states that position is averaged across impressions for a single query, so several impressions at different ranks collapse into one query-level number.
That number hides which URL earned the ranking. It also hides whether two pages alternated in the results.
I recommend calculating at the keyword-and-URL level first, then setting an explicit domain rule. For a single-result model, count the selected ranking once per query. Keep extra ranking URLs in a diagnostic field so overlap stays visible without double counting opportunity.
Where the Score Misleads You
A visibility score can rise while traffic falls. In Seer Interactive's account of its AI Overviews CTR analysis, a study covering more than 25 million organic impressions across 3,119 queries found roughly a 61% decline in organic CTR for informational queries displaying Google AI Overviews.
Do not apply that decline as a universal adjustment to your forecast. Test whether your assumed CTR still describes the SERPs you target, query by query.
Keep exposure and outcomes separate
I would maintain distinct dashboard measures rather than blend everything into a more impressive number:
- Ranking visibility: Your position-weighted opportunity across the fixed keyword set.
- SERP prominence: Where your result appears relative to ads, answer panels, and other search features.
- AI citation visibility: Whether an answer mentions your domain or links to a specific page.
- Outcomes: Search Console clicks, organic sessions, conversions, assisted conversions, and revenue where attribution permits.
These measures answer different questions. You can gain a traditional ranking without gaining screen prominence. You can gain an AI citation without receiving a visit.
A ranking-only score does not increase because you received an AI citation. It increases only if your metric explicitly includes AI exposure.
Reading score movements against clicks and conversions
| Score movement | Clicks and conversions | Likely cause | Check first |
|---|---|---|---|
| Score up | Clicks down | Informational exposure increased, potentially including AI answers, while click opportunity weakened | Cited URLs and AI referral sessions |
| Score flat | Clicks down | An AI Overview or other feature now sits above your result | SERP feature presence per keyword |
| Score down | Clicks flat | Low-value query contributions weakened, or the tracked set changed | Keyword set weighting and volume changes |
| Score up | Conversions flat | Gains came from low-intent queries | Commercial intent of the keywords that moved |
Treat these as diagnostic hypotheses, not automatic explanations. Segment the movement before you act.
A flat score with falling clicks deserves a SERP inspection before a rewrite. If your organic position has not changed but a new feature occupies the space above it, changing the title alone may not address the main problem.
A rising score can also come from a measurement mistake. Expanding the tracked set with informational queries and comparing the new aggregate with the old one does not demonstrate improvement on a consistent portfolio. When the set remains fixed, split the movement by intent. Informational gains can support discovery, but they do not cancel a decline in commercial visibility.
Keep conversions beside clicks, too. If clicks improve but qualified leads do not, examine landing page fit and conversion tracking before concluding that the ranking work failed.
Don't celebrate a visibility gain until you can name the queries, landing pages, and business outcomes behind it.
Never report the score alone, and never describe low-value exposure as revenue growth.
Tracking AI Overviews as a Separate Layer
Classic rankings don't describe every route into an AI-generated answer. Google's guidance on AI features explains that AI Overviews provide links for further exploration and may use query fan-out, issuing related searches across subtopics and sources to develop an answer.
That gives you a reason to inspect citations independently rather than infer them from organic positions. You can rank well and be absent from the cited sources, or earn a supporting citation without holding a leading classic result.
Keep that additional layer visible in your dashboard.

Record presence, attribution, and destination
For each tracked query, preserve these separate fields:
- AI Overview present: Record whether the feature appeared in that observation, including the market, device, and date.
- Domain mentioned or linked: Distinguish an unlinked mention from a clickable citation rather than combining both into one affirmative field.
- Exact URL cited: Save the destination so you can identify which page supports the answer.
Use an explicit missing-observation status when a check fails. Otherwise, you can't distinguish absence from incomplete collection.
For implementation detail, use our guide to tracking AI Overviews. When you're deciding what to improve on a candidate page, Contesimal's guide to AI Overviews provides a complementary optimization reference.
Keep the collection workflow and the optimization workflow separate. You need a dependable baseline before you can evaluate whether a content change improved citation coverage.
For a video walkthrough, use the following resource.
Review appearances without inventing attribution
Tag each keyword with its observed AI status, retain its cited URL, and review the pattern monthly. Compare appearance changes with landing-page clicks, but don't label every subsequent visit as AI-driven discovery.
You'll need care with referral reporting: an AI Overview appearance doesn't necessarily produce a separately identifiable AI referral session. Preserve the distinction between what you observed in the SERP and what your analytics can attribute.
AI exposure also changes independently of your edits. In Semrush's study of more than 10 million keywords, AI Overviews appeared on 6.49% of tracked keywords in January 2025, nearly 25% in July, and 15.69% in November. Inspect changes in feature availability before crediting or blaming your own work.
Raising Your Score Without Chasing Noise
I would start with commercially relevant queries ranking fourth through tenth that have meaningful demand. Filter your keyword export by position, then inspect the ranking URL and search intent before sorting by estimated upside.
Don't choose the highest-volume row. A query with strong demand but poor product fit can absorb substantial work without producing useful visitors.
Prioritize a plausible page improvement
For each candidate, inspect the live results and decide what prevents your intended page from competing:
- Intent mismatch: Compare the page format with what searchers currently receive. A product page may not satisfy a query dominated by detailed tutorials.
- Incomplete answers: Add the missing explanation, comparison, specification, or example that a buyer needs.
- Weak internal discovery: Add relevant internal links from established pages using descriptive anchor text.
- Wrong ranking URL: Check whether a supporting article ranks instead of the page designed to handle the query.
Don't dismiss queries outside the modelled cutoff as worthless. They contribute nothing to this simplified calculation, but that doesn't mean they have no strategic value. I would usually prioritize a credible near-term improvement over a distant ranking that requires a different page, stronger evidence, and substantial authority-building.
Before editing, check the page's eligibility. Google's explanation of how Search works separates crawling, indexing, and serving results, so confirm that your intended URL is indexed and selected for the query.
Resolve overlap before publishing more
When multiple pages target the same need, map the keyword cluster to an intended primary page. Compare the competing URLs' purpose, content, internal links, and conversion role before choosing consolidation.
Merge pages when they duplicate the same job. Differentiate them when they serve distinct audiences or stages of the buying journey. Don't redirect a useful comparison page into a generic category page merely to simplify your spreadsheet.
Prioritization rule: Fix the page-selection problem before expanding the content inventory.
Use historical SERP snapshots to check whether a movement persists. I would review a year of history for priority queries where available, rather than trigger a rewrite from a brief dip.
Keep new keyword discoveries in a separate queue until the next measurement period. If you change the production set, version it and establish a fresh baseline instead of extending the old trend line.
From the beginning, I would also maintain commercial-intent segments alongside the standard volume-weighted score. If you create a business-weighted version, label it clearly and preserve its weighting rules.
Measure monthly, log cited URLs, and review the relationship between visibility and clicks each quarter. That routine gives you a decision record, not just a dashboard screenshot.
Confirm Your Score Against Clicks Before You Act
Before approving a report or an optimization sprint, compare visibility with Search Console clicks for the same keyword set and period. Pull query-and-page records where available, and keep country, device, and search type aligned.
If the directions disagree, use observed clicks to judge traffic performance and investigate the model. Check keyword-set changes, demand updates, missing observations, and SERP features before assuming that you need to rewrite content.
Lock the next measurement
Preserve a repeatable setup:
- Keyword list and URL mapping: Retain the actual ranking page and intended destination.
- CTR assumptions and cutoff: Keep the calculation consistent and version any changes.
- Comparison period: Align the visibility snapshot with the click-reporting window.
At SemDash, we show the specific page Google sends traffic to for every keyword, which helps remove guesswork from URL mapping. Use that mapping alongside an organic traffic analysis workflow to investigate differences rather than relying on the aggregate.
No tool can guarantee rankings, traffic, or revenue. We don't guarantee specific search rankings, traffic increases, or financial outcomes, and I would treat the score as a directional guide rather than a forecast.
This week, export your keywords with positions and volumes, run the five-step calculation, and compare the result with last quarter's clicks for those same queries. If historical ranking inputs aren't available, establish today's baseline instead of inventing a historical score.
We offer more than 20 SEO research tools, with free access to get started, so you can investigate keywords, ranking pages, and competitive gaps behind your visibility score. Visit SemDash to map your current rankings to their landing pages and build a baseline you can check against actual clicks.